Aquaculture has experienced an impressive change regarding management methods. In the case of shrimp, back in the 1980s and 1990s, extensive production meant a minimal production cost; there was no feeding, no aeration, and in some cases, no pumping, and even no seed costs since the postlarvae or juvenile shrimp were gathered from the wild. Furthermore, the supply was smaller, making shrimp a costly product, meaning high selling prices and low production costs. As a result, profit margins for shrimp farmers were huge, which meant administration and production management could be sloppy, and still, the farm would be profitable.
As shrimp farming gained terrain and production worldwide increased, the price of the product started to diminish, which led to an intensification of production; this meant higher densities, feeding, aeration, and, overall, higher production costs. The idea behind this was to balance the loss in price and cost increase by increasing productivity. For this strategy to work, farmers need to control their production costs as much as possible, meaning that management methods need to improve, optimizing feed rations, controlling water quality, minimizing mortalities, and increasing control over the farm.
There are many levels at which a farm needs to be managed. First is the operative level, where farmers need to manage and control several components on a day-to-day basis, such as water quality, feeding, and health of the organisms. The second level is production strategy, where farm managers need to develop strategies for input acquisition, application and storage, selecting the harvest and seeding strategies, and all the decisions regarding the short-term or per-cycle performance of the farm. The third level is the financial and corporative level, where long-term strategic investments need to be made, assuring the continuity and sustainability of the farm.
Data and analysis are crucial to obtaining the best results at all management levels. To correctly assess the type of production to use, the inputs needed, the amount of feed used, the moment to harvest, and the investment required for growth, among others, managers use and transform data looking for the best solution possible without risking the farm’s profitability.
For data to be beneficial, it must be processed, treated, and presented in an accessible way, such as through graphs or tables. One particular form of giving information in a fast, accessible, and homogeneous fashion is the use of key performance indicators or KPIs.
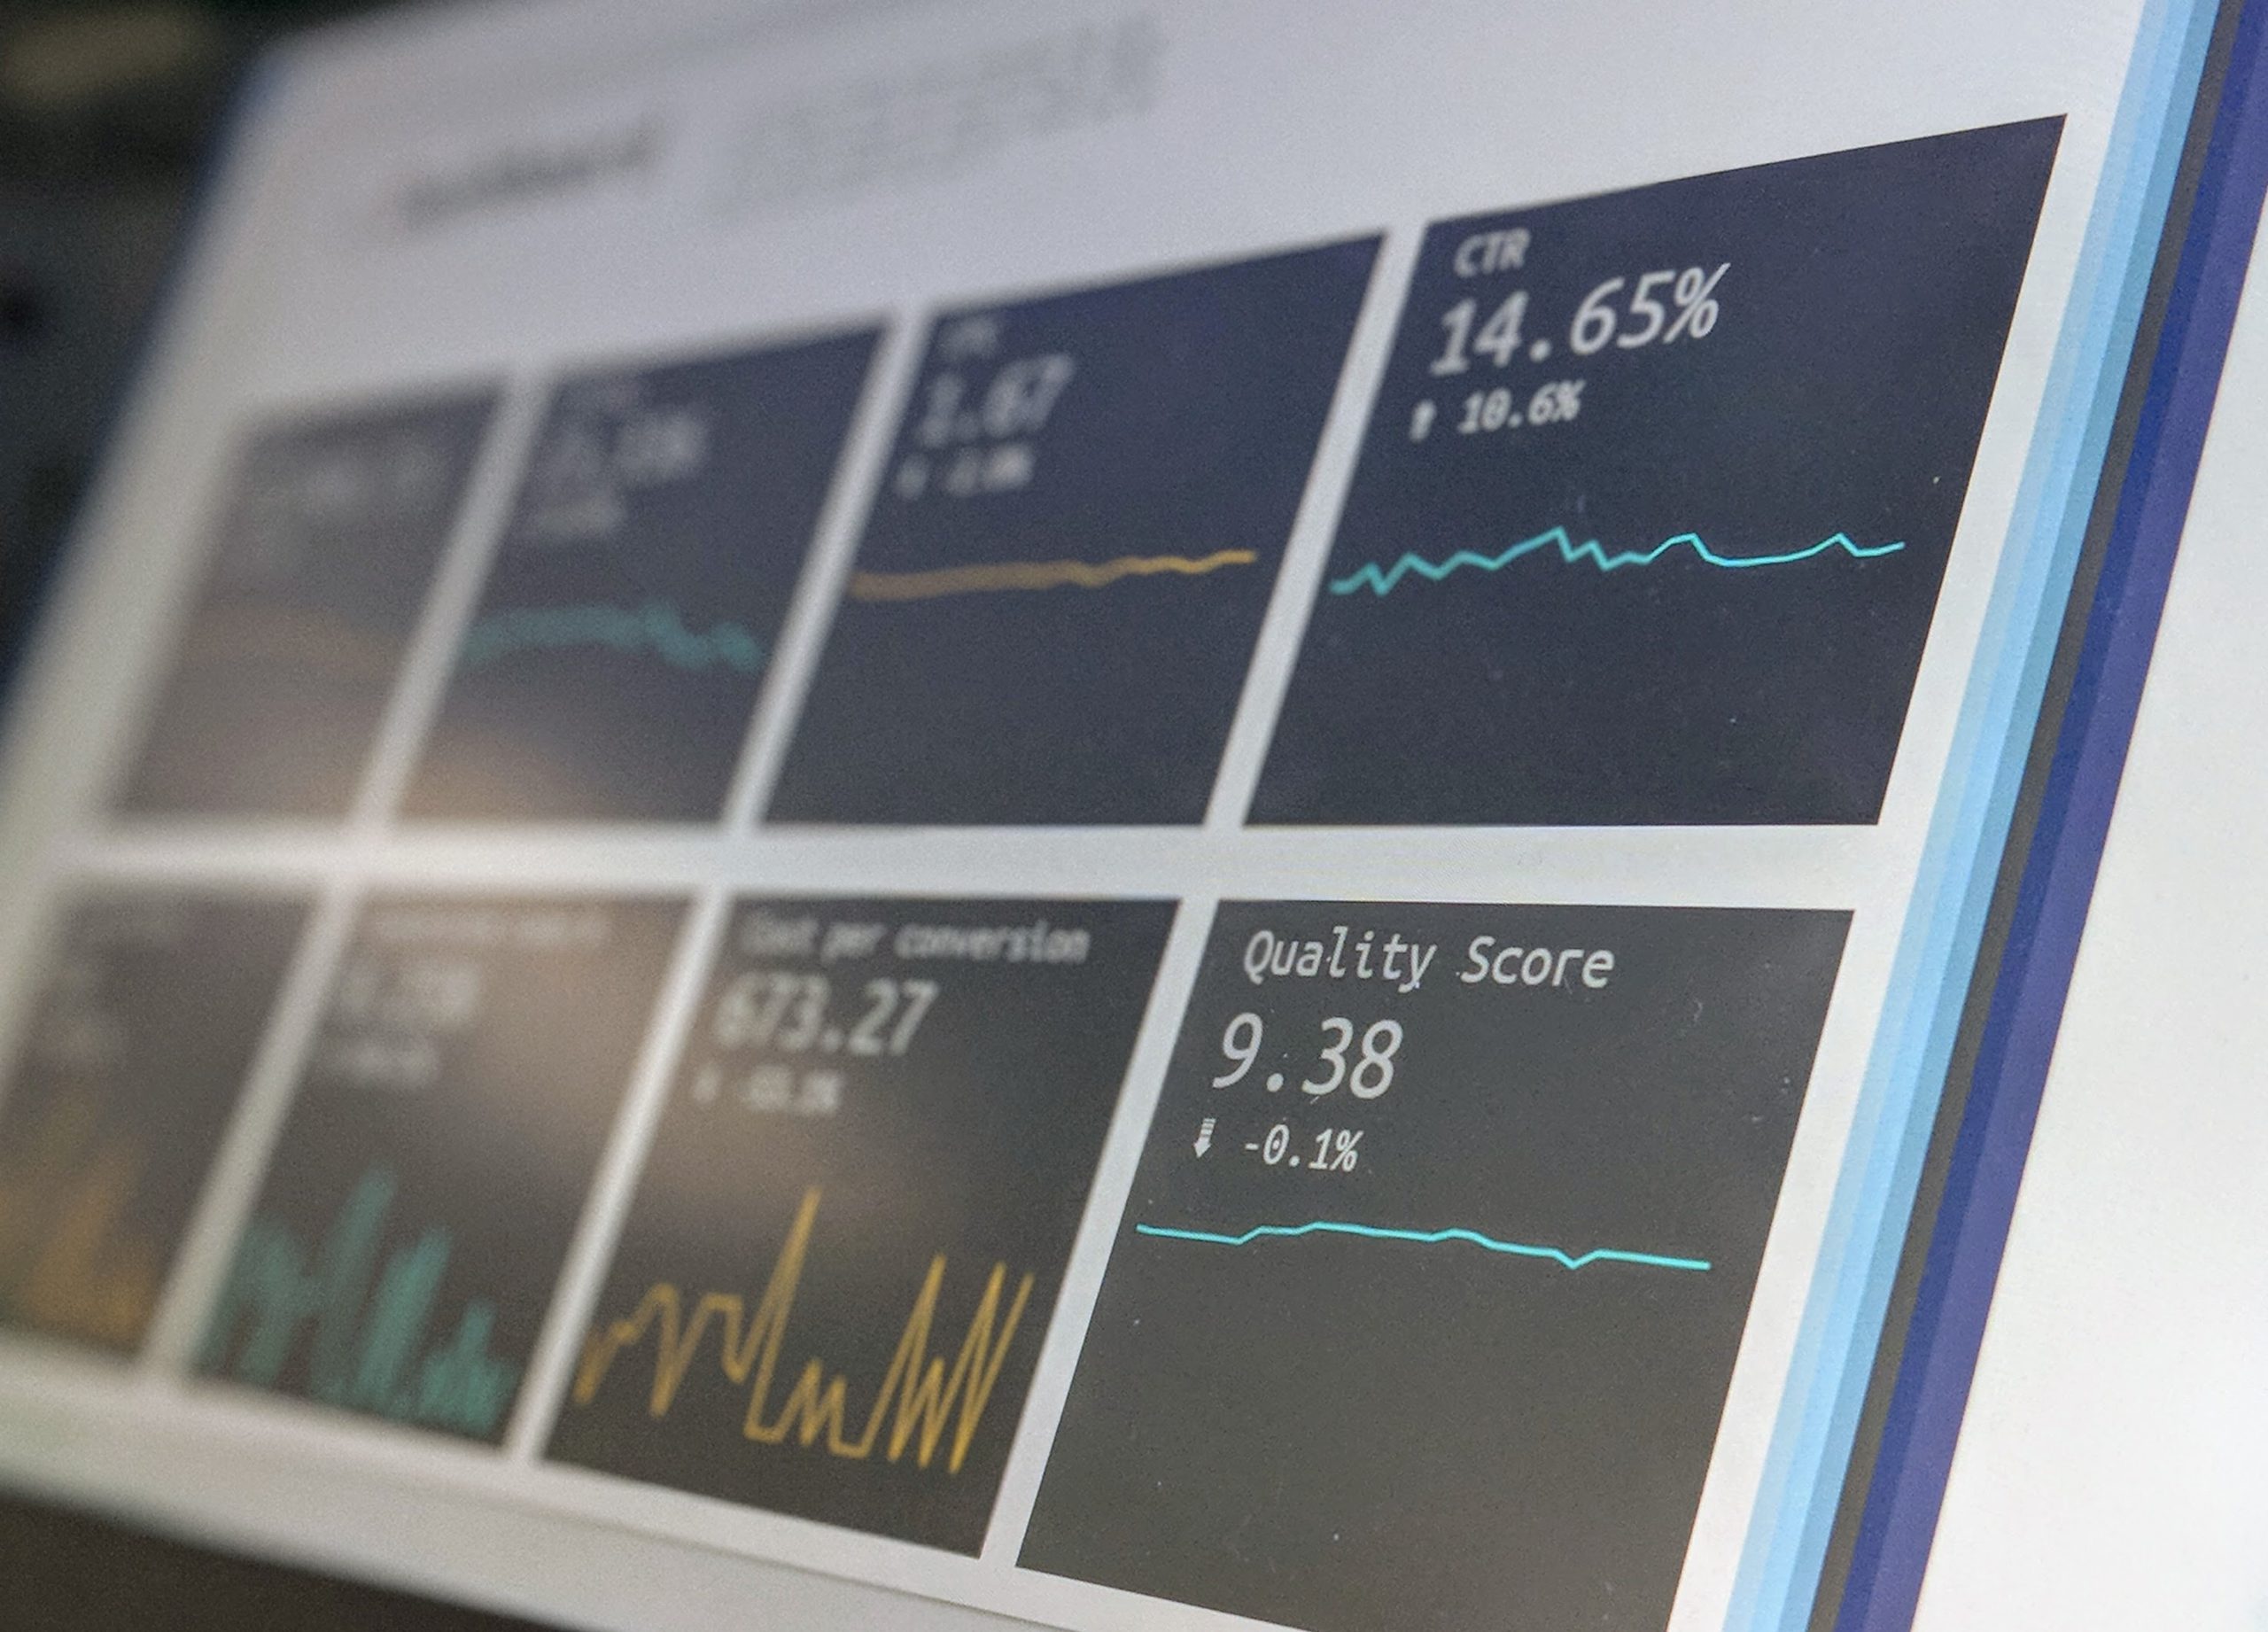
Building and understanding KPIs
A KPI is a numerical indicator that shows the farm’s performance in a homogeneous and accessible manner. The idea behind a KPI is to quickly glimpse the state of production, looking into critical aspects of the business. Therefore, KPIs respond directly to the farmer’s strategic view and information needs. That means that each farmer can develop and use their own KPIs, usually following some rules:
1.- KPIs must rely on measurable, objective, and reliable data. Like all indicators, their value is absolutely dependent on the quality of the data gathered. Even if the indicator is well designed and calculated if the data is flawed, so will the KPI, and the information we receive will also be poor, which could provide misleading insights of poor (or good) performance, leading to changes in management that could be detrimental for the farm.
2.- They must be precise. Assuming the data is flawless, indicators must present as much precision as possible. For example, if we have biomass per unit of area as a KPI (i.e., tons per hectare), changes in the decimal points could change the financial performance of the farm, or if we underestimate mortality, we could fall into an overfeeding episode, leading to bad water quality and overall poor biological and economic performance.
3.- They should be homogeneous in units, so benchmarking is possible between ponds or even between farms. This means that, when possible, KPIs should be presented in international measure units and further standardized per unit of area, time, weight, etc., so that different systems can be compared. For example, if we intend to evaluate the productivity of the farm, the biomass value alone (tons) might be misleading since ponds can have different areas and shapes; hence the farmer must account for the characteristics of their farms. If, on the other hand, we evaluate productivity per unit of area (i.e., tons per hectare, kg per m2, or any other combination), then we can benchmark different sized ponds and even different production strategies.
4.- They must be relevant, meaning that they should focus on the most significant aspects of production and performance. This might sound trivial, but some people might think that the more KPIs, the more information, and therefore one should calculate and present as many KPIs as possible. But that would be a mistake. Although it’s true that the more KPIs one has, the more information is available, the importance of said information is relative and might mask the importance of other indicators. There is such a thing as too much information. The number of KPIs used by a farmer is up to them and their experience, but let’s not forget the K in KPI stands for key, so only the most significant indicators should pass the cut.
5.- They must be periodical. Time is critical in aquaculture, and therefore, KPIs must have some sort of periodicity. This will allow to follow production and adjust when necessary in order to improve the value of a KPI and achieve the specified goals. This doesn’t mean that all KPIs need to involve time. Still, their calculation should include specific time lapses to be accurately compared within and between cycles and effectively know the proximity to the objectives for the particular period. For example, we might have a final weight goal of 20 grams per individual (that is our objective); if by week 2 of production we have 2gr individuals, are we underperforming just because we are too far from 20 grams? Not necessarily; we need to compare the objective KPI for week two. The same goes for all KPIs, meaning there needs to be periodicity both in the objectives set and the indicators themselves.
As mentioned above, the main objective of KPIs is to present the state of production in a fast, comparable, and precise manner, and they can serve in several layers of the farm’s management.
One of the primary uses of KPIs is the ability to set production objectives. Using models or previous production cycles, a farmer can select specific objectives in each indicator so that the farm achieves its general goals: maximum profitability, minimum environmental impact, maximum weight increase over time, or whichever other goals were set. Meanwhile, the continuous follow-up of the performance is used in the first and second layers of management to know if their performance is average, above, or below average and where they can intervene to improve the farm’s performance.
Since KPIs are homogeneous in units, they can be used to benchmark our own farm’s performance, other production periods, how our ponds are performing between each other, and even how we are doing when compared to other similar farms. This information allows us to know if our performance is good, and if not, where are our improvement windows, what we need to do to improve, and where we could be if we adjust our methods.
Although there is no list of the specific KPIs used in shrimp aquaculture, several indicators are common to all farms. Our next entry will discuss the top 10 KPIs used to oversee the most significant aspects of shrimp farming concerning productivity and financial performance and how to calculate and interpret them.