
The benefits obtained from shrimp production depend on the biomass harvested, which, in turn, is defined by the growth and survival of the organisms produced. The benefits attributed to the use of Biofloc technology are several, helping both: growth and survival.
In the case of growth, the use of probiotic bacteria helps the digestive processes of the shrimp produced in different ways, being the most important the production of digestive enzymes by bacteria, reducing the energy consumed by shrimp, facilitating the absorption of nutrients hence maximizing the feed’s benefits. Also, the production of flocs, which are eaten by shrimp, increases the availability of protein, which in turn produces a lower feed conversion ratio, allowing a reduction of production costs, increasing the farm’s performance.
The use of bioremediants and probiotics also increase the shrimp’s survival in different ways. First, by the inhibition of pathogen bacteria growth through a process called competitive exclusion (that is, the competition for nutrients and space with the probiotic bacteria). Secondly, probiotics have showed to have a boosting effect on several aquaculture species’ immune systems, including shrimp. Finally, bioremediation increases water quality by eliminating the presence of ammonia.
Despite all benefits presented by this technology, its important to define the dosage that better impacts our production. According to this research[DP1] , the dose that maximizes survival in shrimp larvae is not the same as the one that maximizes economic performance of a laboratory. The reason behind this is associated to the economic concept of marginal analysis, that is, the values associated with a change of one unit of a resource. In other words, how much does an additional unit of probiotic costs, and how much income will an additional kg of shrimp will generate.
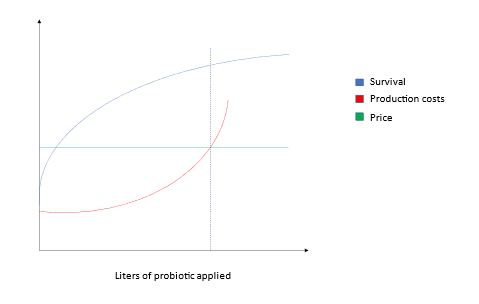
Even though high doses of probiotics might result in high survival rates, there is a dose where each new litre of probiotic added has a lesser impact on production, that creates a point where the effect on survival does not justify the investment in the technology. That point is the optimal dose of probiotics to be administrated in a particular case, which is relative to the selling price and the probiotic’s production costs, as showed in the image above.
How do I calculate my optimal dose?
The first thing you need to do is to pinpoint your production costs. Its important to differentiate between average unit costs and marginal costs. The first is defined as the average cost of producing each unit, that means your total production divided by your total costs. The second one is a little bit trickier, since you need to preform a differential equation, where you evaluate your costs (C) on terms of production (Q), that is

In simpler, numerical terms, you can also define marginal costs as
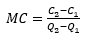
Where C1 represents the cost associate to the production using the first unit of probiotics, C2 is the cost associated to the next additional unit of probiotics, Q2 is the quantity of shrimp produced with the second unit of probiotics, and Q1 is the quantity produced with my first dose of probiotics. With this information, you can produce a curve as shown in the figure above.
Once you got the marginal costs, you can observe the optimum dose of probiotics to use depending on the selling price, which will be equal to the point where both curves intersect
As usual, the information you have on your farm is crucial to correctly estimate this kind of metrics, and the technical requirement for analysis is high; but it is worth it, since this method can increase benefits up to 26%, reducing average unit costs by 44%. Using this method, survival is reduced compared to what can be achieved with higher doses of probiotics, nonetheless, the overall economic performance of the farm is increased by optimizing operational costs.
Application example
For simplicity, let’s use a shrimp hatchery as example, where the product is sold by number (thousand postlarvae or PL) instead of biomass. In this case, probiotics only have a significant effect on the laboratory’s economic performance regarding larvae survival.
Let’s imagine that the hatchery manager has been using commercial lyophilized probiotics in its laboratory as a mean to increase survival. He has observed that the more probiotics he adds, the higher the survival rate and higher income.
| Probiotics (gr m-3 day-1) | Survival | Harvest (thousand PL year-1) | Total Costs (USD year-1) | Average Unit Cost (USD per thousand larvae) | Income (USD year-1) |
| 1 | 49% | 934,562 | $ 248,888.78 | $ 0.27 | $ 4,672,809 |
| 10 | 56% | 1,063,139 | $ 491,284.20 | $ 0.46 | $ 5,315,696 |
| 20 | 63% | 1,201,063 | $ 760,612.44 | $ 0.63 | $ 6,005,316 |
| 30 | 70% | 1,328,502 | $ 1,029,940.69 | $ 0.78 | $ 6,642,511 |
| 40 | 76% | 1,441,605 | $ 1,299,268.93 | $ 0.90 | $ 7,208,026 |
| 50 | 81% | 1,538,452 | $ 1,568,637.78 | $ 1.02 | $ 7,692,261 |
| 60 | 85% | 1,618,868 | $ 1,837,966.02 | $ 1.14 | $ 8,094,341 |
| 70 | 89% | 1,683,953 | $ 2,107,294.27 | $ 1.25 | $ 8,419,765 |
| 80 | 91% | 1,735,547 | $ 2,376,622.51 | $ 1.37 | $ 8,677,733 |
| 90 | 93% | 1,775,776 | $ 2,645,950.75 | $ 1.49 | $ 8,878,880 |
| 100 | 95% | 1,806,743 | $ 2,915,279.00 | $ 1.61 | $ 9,033,714 |
Nonetheless, he has been told to check the production costs, which are increasing, even average production costs do not seem justify the application of the product. With this idea, the producer asks, is the use of probiotics profitable? And if they are, how much should I add?
Following what has been explained above, the producer calculates the marginal costs following the numerical formula for marginal costs
![]()
Subtracting the costs observed with the second dose of probiotics (C2) which is equal to $ 491,284.20 USD per year to the costs associated with the next lesser dose of probiotics (C1), which is equal to $ 248,888.78 USD per year and then dividing the difference obtained in production, that is, the amount of larvae harvested with the second dose of probiotics (Q2) equal to 1,063,139 thousand PL per year minus the larvae harvested using the lesser amount of probiotics (Q1) which is 934,562 thousand PL per year.
| Probiotics (gr m-3 day-1) | Harvest (thousand PL year-1) | Total Cost (USD year-1) | Marginal Cost (USD) |
| 1 | 934,562 | $ 248,888.78 | |
| 10 | 1,063,139 | $ 491,284.20 | $ 1.89 |
| 20 | 1,201,063 | $ 760,612.44 | $ 1.95 |
| 30 | 1,328,502 | $ 1,029,940.69 | $ 2.11 |
| 40 | 1,441,605 | $ 1,299,268.93 | $ 2.38 |
| 50 | 1,538,452 | $ 1,568,637.78 | $ 2.78 |
| 60 | 1,618,868 | $ 1,837,966.02 | $ 3.35 |
| 70 | 1,683,953 | $ 2,107,294.27 | $ 4.14 |
| 80 | 1,735,547 | $ 2,376,622.51 | $ 5.22 |
| 90 | 1,775,776 | $ 2,645,950.75 | $ 6.69 |
| 100 | 1,806,743 | $ 2,915,279.00 | $ 8.70 |
Still, the producer observes a constant increase in marginal costs, so he might believe that the technology is not profitable, but it is very important to see the rate at which the marginal costs increase. According to economic theory, the point that optimizes our returns is where the marginal costs equal the marginal income, in this case, the marginal income is equal to the selling price. In this example, the optimum dose equals approximately 78 gr per cubic meter in this example (see figure below)
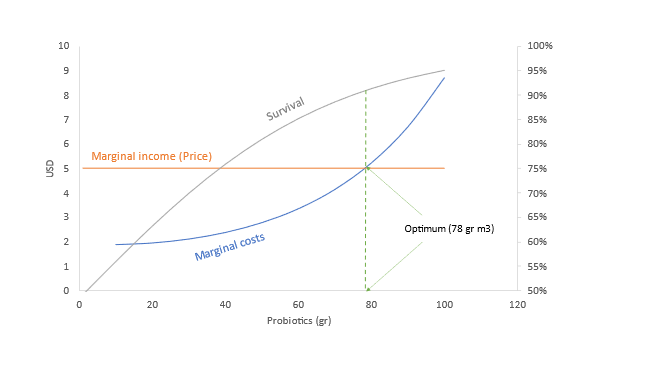
As you can see, the survival obtained with this dose is around 90%, if the dose is increased to 100 gr per cubic meter, survival increases to 95%, but the costs associated to the production of an extra batch of larvae is not justified, even incurring in losses, which might be difficult to detect.
If you would like to discuss this calculation or require assistance with this analysis, please reach out via our online community at https://community.shrimpstar.com/